Decarbonising transport with high-speed rail
Transport modal comparator 2025
1. Transport footprint, context and figures
In France, the transport sector is the biggest emitter of greenhouse gases, accounting for around a third of emissions1. While the average French person emits 10 tonnes ofCO2e per year, we need to reduce this to 2 tonnes ofCO2eper person per year if we are to achieve carbon neutrality by 2050.
Faced with the climate challenge, SNCF Voyageurs is helping to reduce the transport sector's carbon footprint by developing rail services and encouraging modal shift. While trains carry around 10% of passengers, they emit less than 1% of the sector's greenhouse gas emissions. It is therefore unquestionably a solution for sustainable mobility.
In France, travelling by high-speed train reduces greenhouse gas (GHG) emissions by an average of 95% compared with other modes of long-distance transport*.
2. Displaying the carbon footprint of transport
The Grenelle II Environment Act of 2012 made it compulsory to display information on the quantity ofCO2eemissions for each transport service.
The aim of this information is to raise awareness among transport operators of their carbon footprint, so as to encourage them to offer transport services that emit less, and among consumers, so as to guide their choice of transport mode towards those that emit the least carbon.
GHG information (expressed inCO2 equivalent) is communicated to passengers before they make a purchase, when they search for an itinerary on the https://www.sncf-voyageurs.com/fr/voyagez-avec-nous/horaires-et-itineraires/itineraires/ website, in accordance with regulations (article L.1431-3 of the Transport Code).
3. Transport modal comparator
3.1. High-speed rail
The "modal transport comparator" information tool enables both leisure and business travellers to assess the footprint of their journey and make an informed choice of mode of transport. The modal comparison is based on one kilometre travelled in mainland France by one passenger (Vkm), using the different vehicles compared.
The TGV represents long-distance mobility, in the following proportions: 60% of Vkm. Average vehicle occupancy rates are included in the comparator. For the purposes of comparison with high-speed trains, the average occupancy rate used for road transport is 2.2 passengers (long distance).
3.2 Transport modal comparator by passenger/km
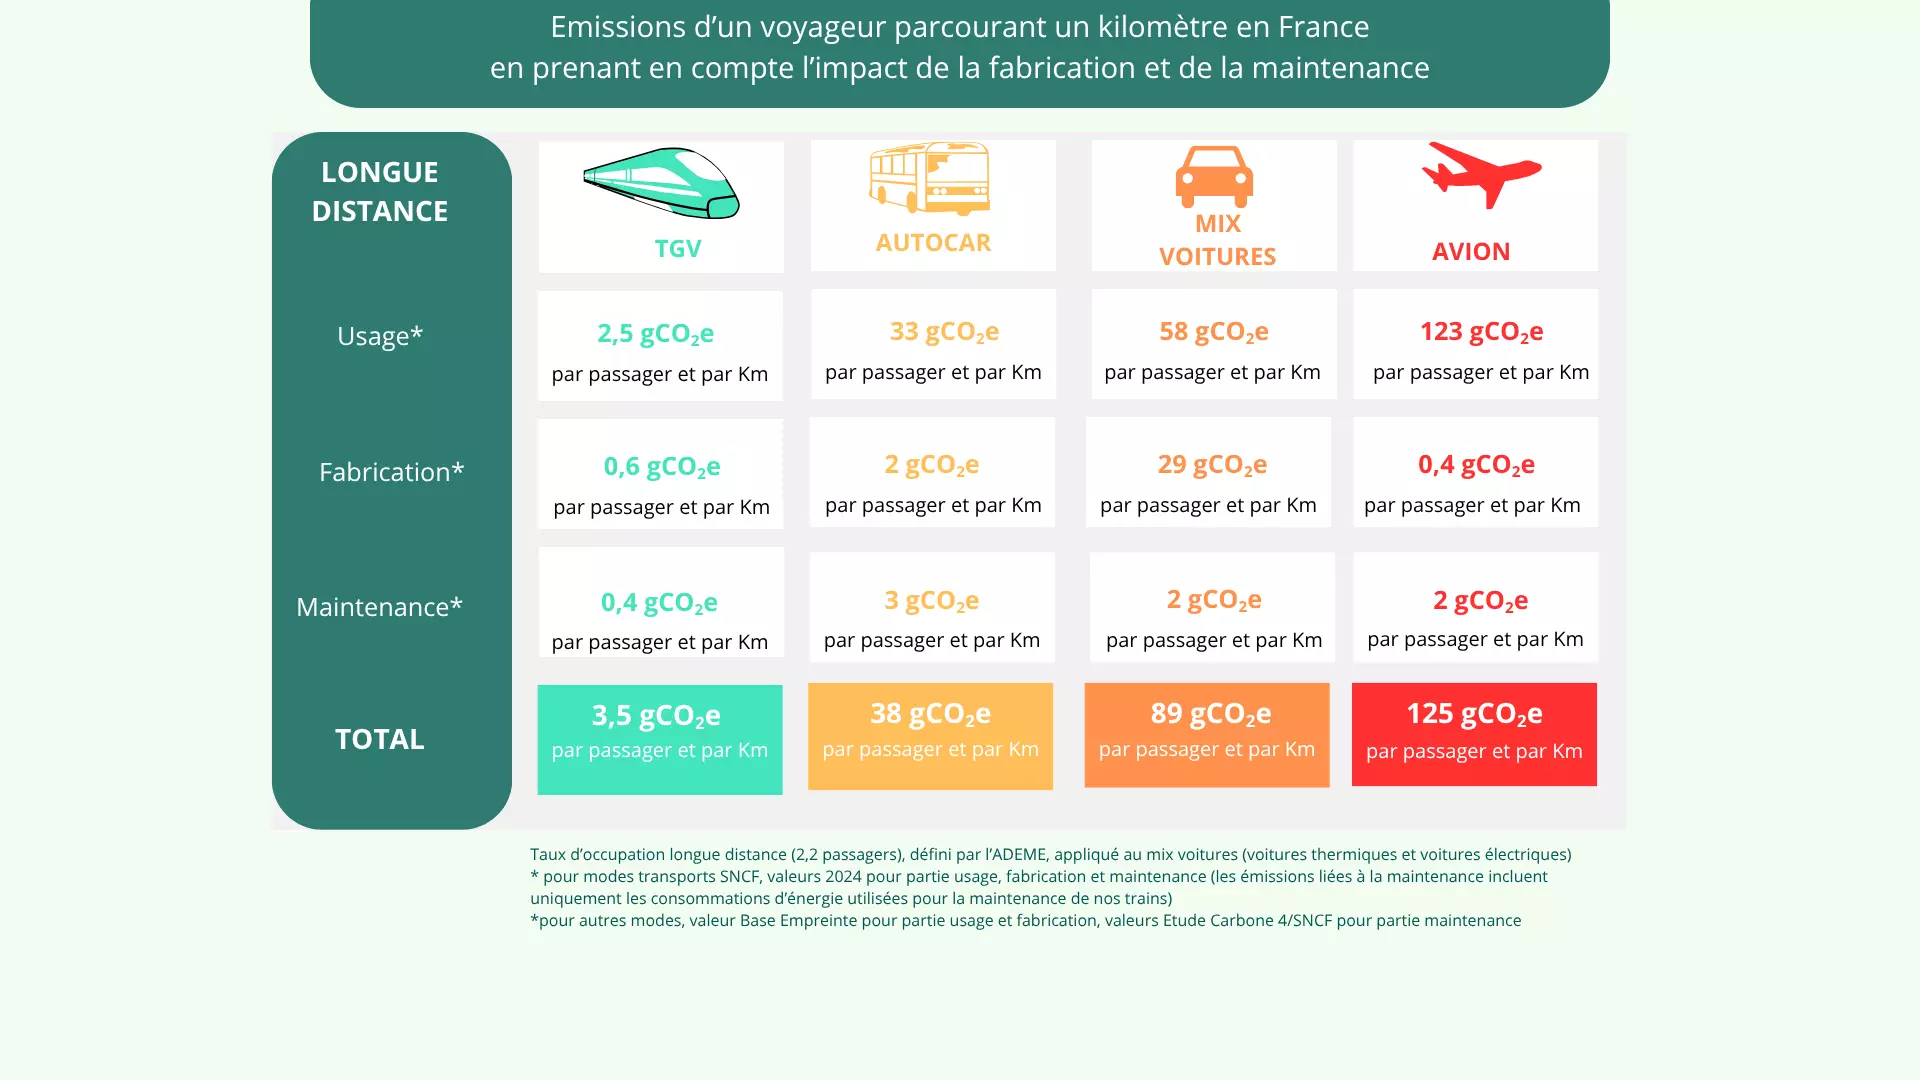
This table shows the emissions for a passenger travelling one kilometre in France, taking into account the impact of manufacturing and maintenance.
- TGV
- Use* 2.5 gCO2eper passenger per km
- Manufacturing* 0.6 gCO2eper passenger and per km
- Maintenance* 0.4 gCO2eper passenger and per Km
- Total 3.5 gCO2eper passenger and per Km
- BUS
- Use* 33 gCO2eper passenger and per Km
- Manufacture* 2 gCO2eper passenger and per Km
- Maintenance* 3 gCO2eper passenger and per Km
- Total 38 gCO2eper passenger and per Km
- CAR MIX
- Use* 58 gCO2eper passenger and per Km
- Manufacturing* 29 gCO2eper passenger and per Km
- Maintenance* 2 gCO2eper passenger and per Km
- Total 89 gCO2eper passenger and per Km
- AIRCRAFT
- Use* 123 gCO2eper passenger and per Km
- Manufacturing* 0.4 gCO2eper passenger and per Km
- Maintenance* 2 gCO2eper passenger and per Km
- Total 125 gCO2eper passenger and per Km
Long-distance occupancy rate (2.2 passengers), as defined by ADEME, applied to the car mix (combustion cars and electric cars).
* For SNCF transport mode, 2024 values for use, manufacture and maintenance (emissions linked to maintenance only include energy consumption used to maintain our trains).
*For other modes, Base empreinte value for use and manufacture, Carbone 4/SNCF study values for maintenance.
(source: GHG information - SNCF Open Data).
Plane/train comparison: the footprint of a plane journey is only compared to that of a long-distance TGV train journey. That is 125g CO2e/Vkm versus 3.5 g CO2e/Vkm.
The car mix is a mix of electric and combustion-powered cars.
3.2.1. The calculation method
A. The CO2e footprint
TheCO2efootprint of a journey is calculated by multiplying the distance travelled on the journey in question by the average quantity ofCO2eemitted per passenger and per kilometre, depending on the mode of transport used.
The average amount ofCO2eemitted per passenger per kilometre (the GHG emissions factor), expressed in gCO2e/km, is calculated using the method shown below.
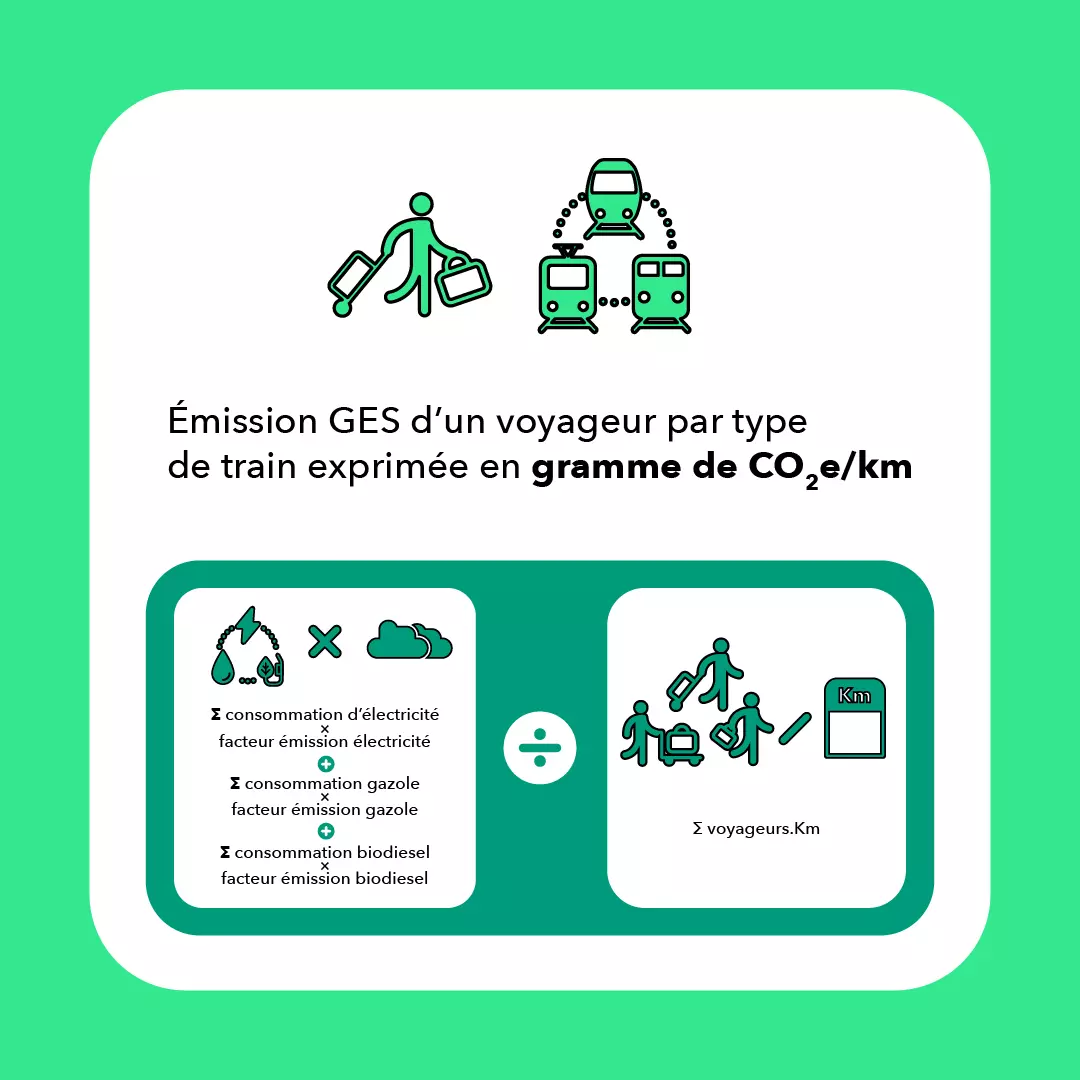
This diagram explains how the carbon footprint of a passenger by type of train is calculated.
On the upper part of the visual, pictograms showing a passenger and different trains with the following legend: GHG emissions of a passenger by type of train expressed in grams ofCO2e/Km.
On the lower part of the visual, pictograms illustrate the formula leading to the above result. This is the ratio between the consumption of electricity, diesel or biodiesel required for the journey in question, multiplied by theCO2e emission factor of the electricity, diesel or biodiesel, and the number of passengers carried over the distance travelled.
This calculation is used each year to establish the average quantity ofCO2e emitted per type of transport per passenger.
B. The comparison indicator
The comparison indicator "In France, travelling by long-distance train rather than by car or plane means reducing greenhouse gas (GHG) emissions by an average of 95%" is calculated on the basis of the carbon footprints of the carriers compared:
- Total carbon footprint (gCO2e.km.person)
- TGV: 3.5 gCO2e.km.person
- Internal combustion car: 89 gCO2e.km.person
- Plane: 125 gCO2e.km.person
- CO2esavings (gCO2e.km.person)
- Formula used: Subtraction between the carbon footprint of the mode of transport compared and that of the train
- Internal combustion car: 89 gCO2e.km.person
- Plane: 121.5 gCO2e.km.person
- Percentage
- Formula used: CO2e savings between the mode of transport compared versus the train / carbon footprint of the mode of transport compared
- Internal combustion car: 96
- Plane: 97
N.B.: To avoid the impact on this indicator of annual changes in emissions factors and to make this indicator more communicative, the comparison indicator used for our communications is reduced to -95%.
3.2.2. Scope of accounting
The accounting perimeters include vehicle use (i.e. the footprint of the fuel or electricity consumed), vehicle maintenance and vehicle manufacture. This scope is applied to the four modes of transport compared above.
- The consumption figures taken into account are the total energy consumption for the previous year (2024), including line losses and all unladen journeys (source: RTE2).
- The energy emission factors (consumption and production) correspond to the average national mix in 2024 for mainland France (source: Base Empreinte ADEME3):
- Electricity = 58 gCO2e/kWh
- Non-road diesel = 3.16 kgCO2e/L
- B100 biodiesel = 1.22 kgCO2e/L
These emission factors are given in accordance with the order of 26 April 2017, issued in application of decree no. 2017-639 of 26 April 2017, relating to information on the quantity of greenhouse gases emitted in connection with a transport service. SNCF uses the average national mix of rail traction electricity4.
4. Appendices
4.1. Regulations
The methodology used by SNCF complies with the regulations (Articles L.1431-3 and D.1431-1 to D.1431-23 of the Transport Code and the associated methodological guide published by the State for GHG information on transport services(https://www.ecologie.gouv.fr/information-ges-des-prestations-transport).
The calculation methodology is based on the European standard for the calculation and declaration of energy and greenhouse gas emissions from transport services (NF EN 16258).
4.2. Source documents
- TGV
- Usage: SNCF 2025 GHG methodology note
- Manufacturing: SNCF 2025 GHG methodology note
- Maintenance: GES SNCF 2025 methodology note
- Coach
- Usage: Base Empreinte ADEME (Coach/diesel)
- Manufacturing: Base Empreinte ADEME (Coach/diesel)
- Maintenance: SNCF/Carbone 4 internal study (2022)
- Electric cars
- Usage: Carbone 4 study - Road transport: what alternative engines for the climate?
- Manufacture: Base Empreinte ADEME (Electric car/Mixed/2018)
- Maintenance: SNCF/Carbone 4 internal study (2022)
- Thermal car
- Usage: Base Empreinte ADEME (Petrol/Mixed/2018)
- Manufacture: Base Empreinte ADEME (Petrol/Mixed/2018)
- Maintenance: SNCF/Carbone 4 internal study (2022)
- Plane
- Usage: Base Empreinte ADEME (Passenger/short-haul aircraft, 2018/Without drag)
- Manufacture: ADEME Footprint database (Passenger/short-haul aircraft, 2018/Without drag)
- Maintenance: SNCF/Carbone 4 internal study (2022)
Nota bene : residual emissions linked to infrastructure are not included. The 2022 Carbone 4 study states that "these infrastructures already exist and vary little, if at all. Their construction emissions have already been emitted, and more frequent use may simply allow them to be better amortised. There is therefore no point in including them in the comparison, as the choice of one mode of transport or another will not affect their emissions. What's more, since the carbon footprint of infrastructure maintenance is much lower than that of construction, the fact that infrastructure is not included in our study is not an obstacle to a comparison of emissions aimed at informing the choice of a person wishing to travel during the year".
4.3 Overall figures for trains: TGV, INTERCITÉS, TER, Transilien
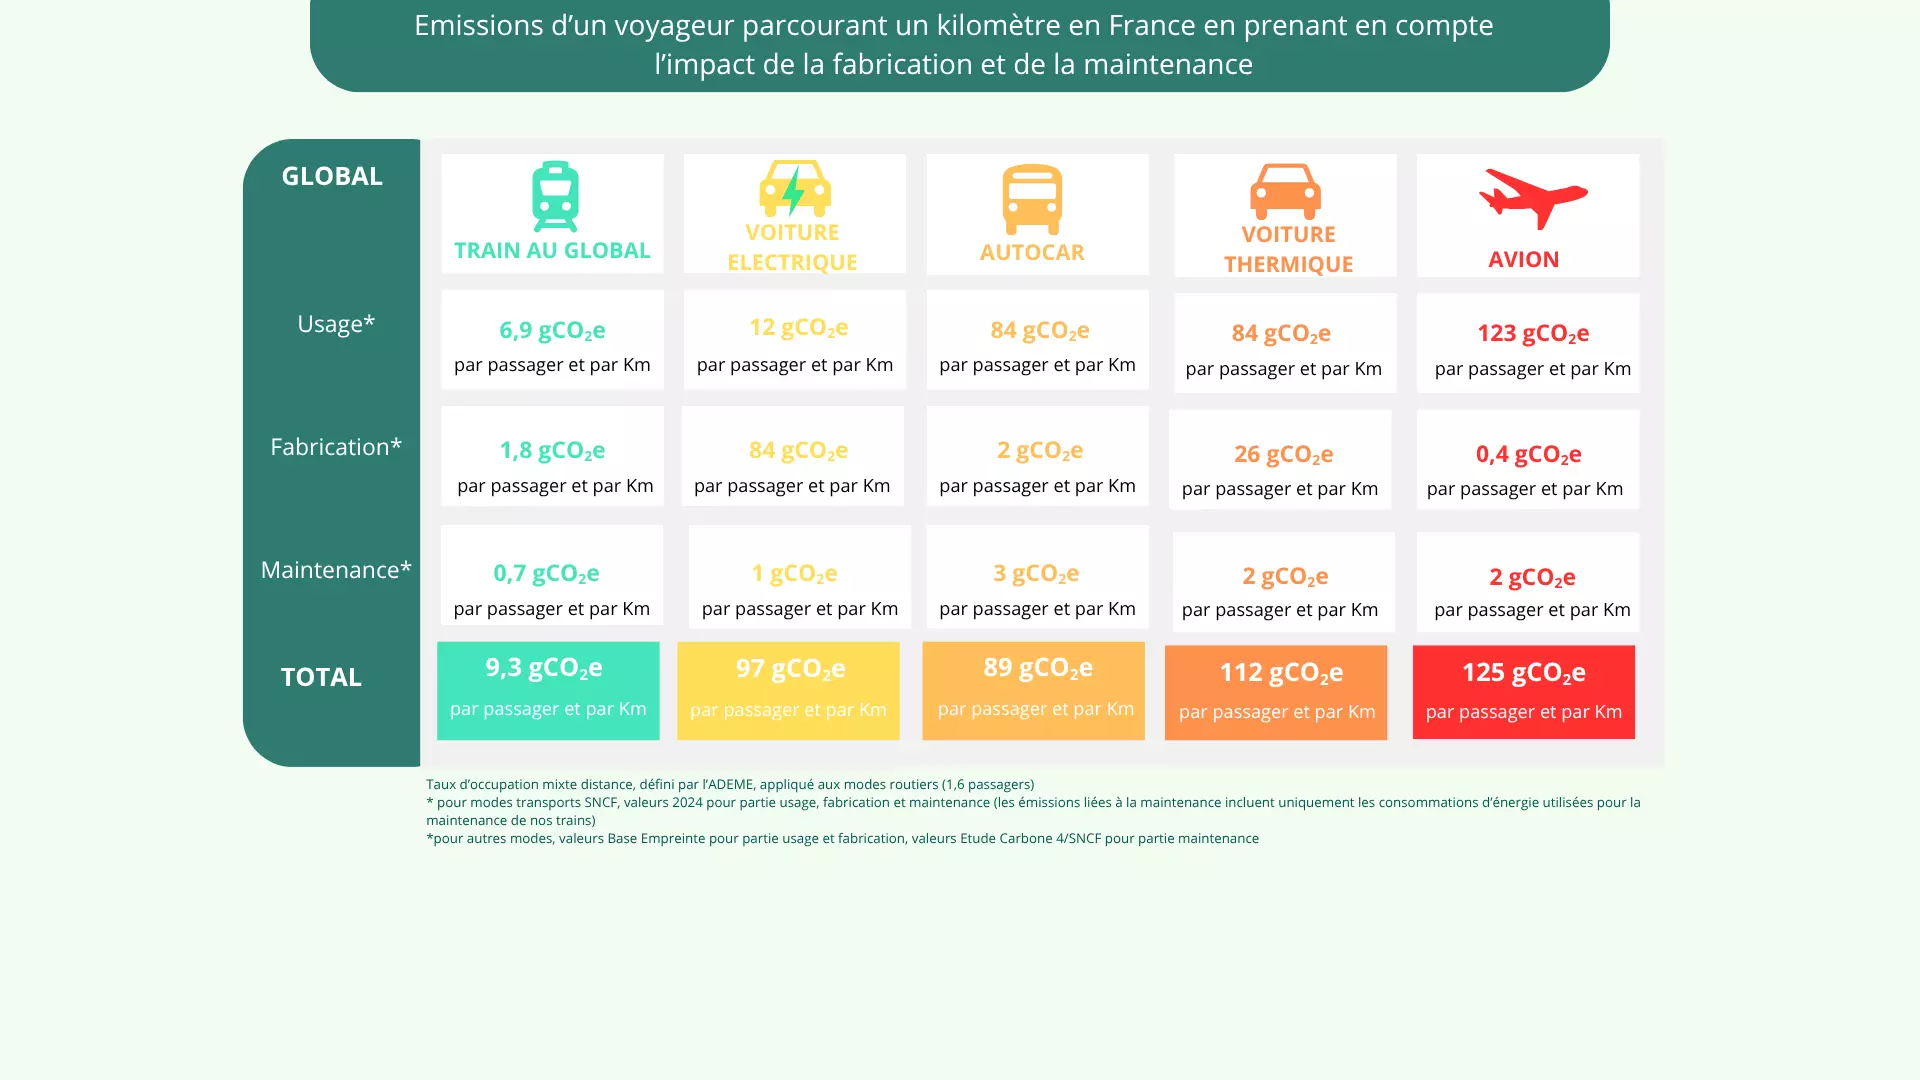
Global train figures (TGV, INTERCITÉS, TER, Transilien)
This table shows the emissions for a passenger travelling one kilometre in France, taking into account the impact of manufacturing and maintenance.
- TRAIN OVERALL
- Use* 6.9 gCO2eper passenger per km
- Manufacture* 1.8 gCO2eper passenger and per Km
- Maintenance* 0.7 gCO2eper passenger and per Km
- Total 9.3 gCO2eper passenger and per Km
- ELECTRIC CAR
- Use* 12 gCO2eper passenger and per Km
- Manufacture* 84 gCO2eper passenger and per Km
- Maintenance* 3 gCO2eper passenger and per Km
- Total 89 gCO2eper passenger and per Km
- BUS
- Use* 84 gCO2eper passenger and per Km
- Manufacturing* 2 gCO2eper passenger and per Km
- Maintenance* 3 gCO2eper passenger and per Km
- Total 89 gCO2eper passenger and per Km
- THERMAL CAR
- Use* 84 gCO2eper passenger and per Km
- Manufacturing* 26 gCO2eper passenger and per Km
- Maintenance* 2 gCO2eper passenger and per Km
- Total 112 gCO2eper passenger and per Km
- AIRCRAFT
- Use* 123 gCO2eper passenger and per Km
- Manufacturing* 0.4 gCO2eper passenger and per Km
- Maintenance* 2 gCO2eper passenger and per Km
- Total 125 gCO2eper passenger and per Km
Mixed distance occupancy rate, defined by ADEME, applied to road modes (1.6 passages)
* For SNCF transport mode, 2024 values for use, manufacture and maintenance (emissions linked to maintenance only include energy consumption used to maintain our trains).
*For other modes, Base empreinte value for use and manufacture, Carbone 4/SNCF study values for maintenance.
*Methodology and details available on this page.
Source: Base Empreinte ADEME 2024(https://base-empreinte.ademe.fr/) and Carbone 4 comparative analysis. Greenhouse gas (GHG) emissions expressed in CO2 equivalent (CO2e) for long-distance trains are calculated in accordance with the methodological guide to GHG information for transport services published by the French government and certified by the Statutory Auditors. These values correspond to an average expressed in passenger-kilometres and include the entire life cycle (use, manufacture and maintenance of the equipment). The comparison is made between a journey by long-distance train in France, by short-haul plane, by long-distance coach and by car, based on a mix representative of the French fleet (internal combustion cars and electric cars) with an average occupancy rate (of 2.2 passengers for long-distance journeys in France, in accordance with ADEME data).
1/ source: Chiffres clés transport 2024 - Ministry for Ecological Transition and Territorial Cohesion
2/ source: RTE (electricity transmission network)
3/ source: Home | Base Empreinte® (ademe.fr)
4/ source: Home | Base Empreinte® (ademe.fr)
Infographic : © SNCF Voyageurs / SNCF Voyageurs
4.3 Overall figures for trains: TGV, INTERCITÉS, TER, Transilien : © SNCF Voyageurs